Case study · Product design
Building the Meta from Zero
Turning scattered creator opinions into a data-driven ranking players actually trust.
- Role
- Product Designer (0 to 1)
- Sector
- Gaming — Companion App / Esports Data
- Scope
- Discovery, data-to-UI translation, end-to-end UX
- Status
- Live · snap.untapped.gg
The problem
Players had no reliable way to know what deck to play. The “meta” lived in scattered creator content and Reddit threads — opinions, not data.
What I did
Designed the Meta / Tier List from zero using real match data from the Companion tracker, and led the debate on what metric should actually define “good.”
The outcome
A tier list players check before deciding what to play — grounded in real match outcomes instead of one creator's opinion.
There was no in-product answer to “what should I play?” Players pieced the meta together from YouTube, Reddit, and Discord.
Those takes were often outdated, contradictory, or just one person's opinion — and there was nothing in the product itself that answered the question players were already asking elsewhere.
Untapped.gg already had something nobody else had: real match data, flowing in live from the Companion tracker every time someone played a game. The opportunity wasn't to build another opinion piece — it was to turn that raw data into the answer.
No existing product to iterate on. The tier list, the ranking logic, and the data model were designed from scratch.
The hardest design decision wasn't visual — it was deciding what “good” means.
| Metric | What it measures | Why it wasn't enough alone |
|---|---|---|
| Winrate | % of games won with the archetype | Rewards decks played by very few, highly skilled players — misleading at low sample sizes |
| Popularity | How often the archetype is played | Popular ≠ good; some decks are played a lot and still underperform |
| Avg. Cubes | Average competitive points earned per match | Captures how much you actually win by, not just whether you won |
Chosen as the primary ranking metric
The decision
Rank by Avg. Cubes. In Marvel Snap, winning big versus winning barely changes your ranked progress — so the metric that reflects competitive performance is the one that should sort the list.
What stayed visible
Winrate and Popularity remained as supporting columns, and Matchups still toggles between Avg. Cubes and Winrate. Pick one default — keep the others honest and available.
Rank by Avg. Cubes, not Winrate
Winrate alone rewards small, skill-inflated samples and ignores how much a match is won by. Avg. Cubes reflects the game's real scoring system — with Winrate and Popularity kept visible as context.
Segment by player context
A tier list is only useful if it matches the player looking at it. Filters for Collection Level, Player Rank, and Time Range let a new player and a top-100 player each see a relevant meta.
Flag low-confidence data instead of hiding it
Decks under a game-count threshold carry a visible “Low Game Volume” flag. The player decides how much to trust it, instead of the product pretending every number carries equal weight.
A tier list players check before they queue up
Real match data, ranked by a metric chosen to reflect actual competitive performance, filtered down to what's relevant for the player looking at it.
- 01
Data ingestion
35,000+ games in the 7-day window
- 02
Ranking logic
Statistical tiers, not hand-placed
- 03
Personalization filters
Collection, rank, and time range
- 04
Deck drill-down
From archetype to decks, one click to copy
Every match tracked via the Companion overlay feeds the meta — 35,000+ games in the current 7-day window alone.
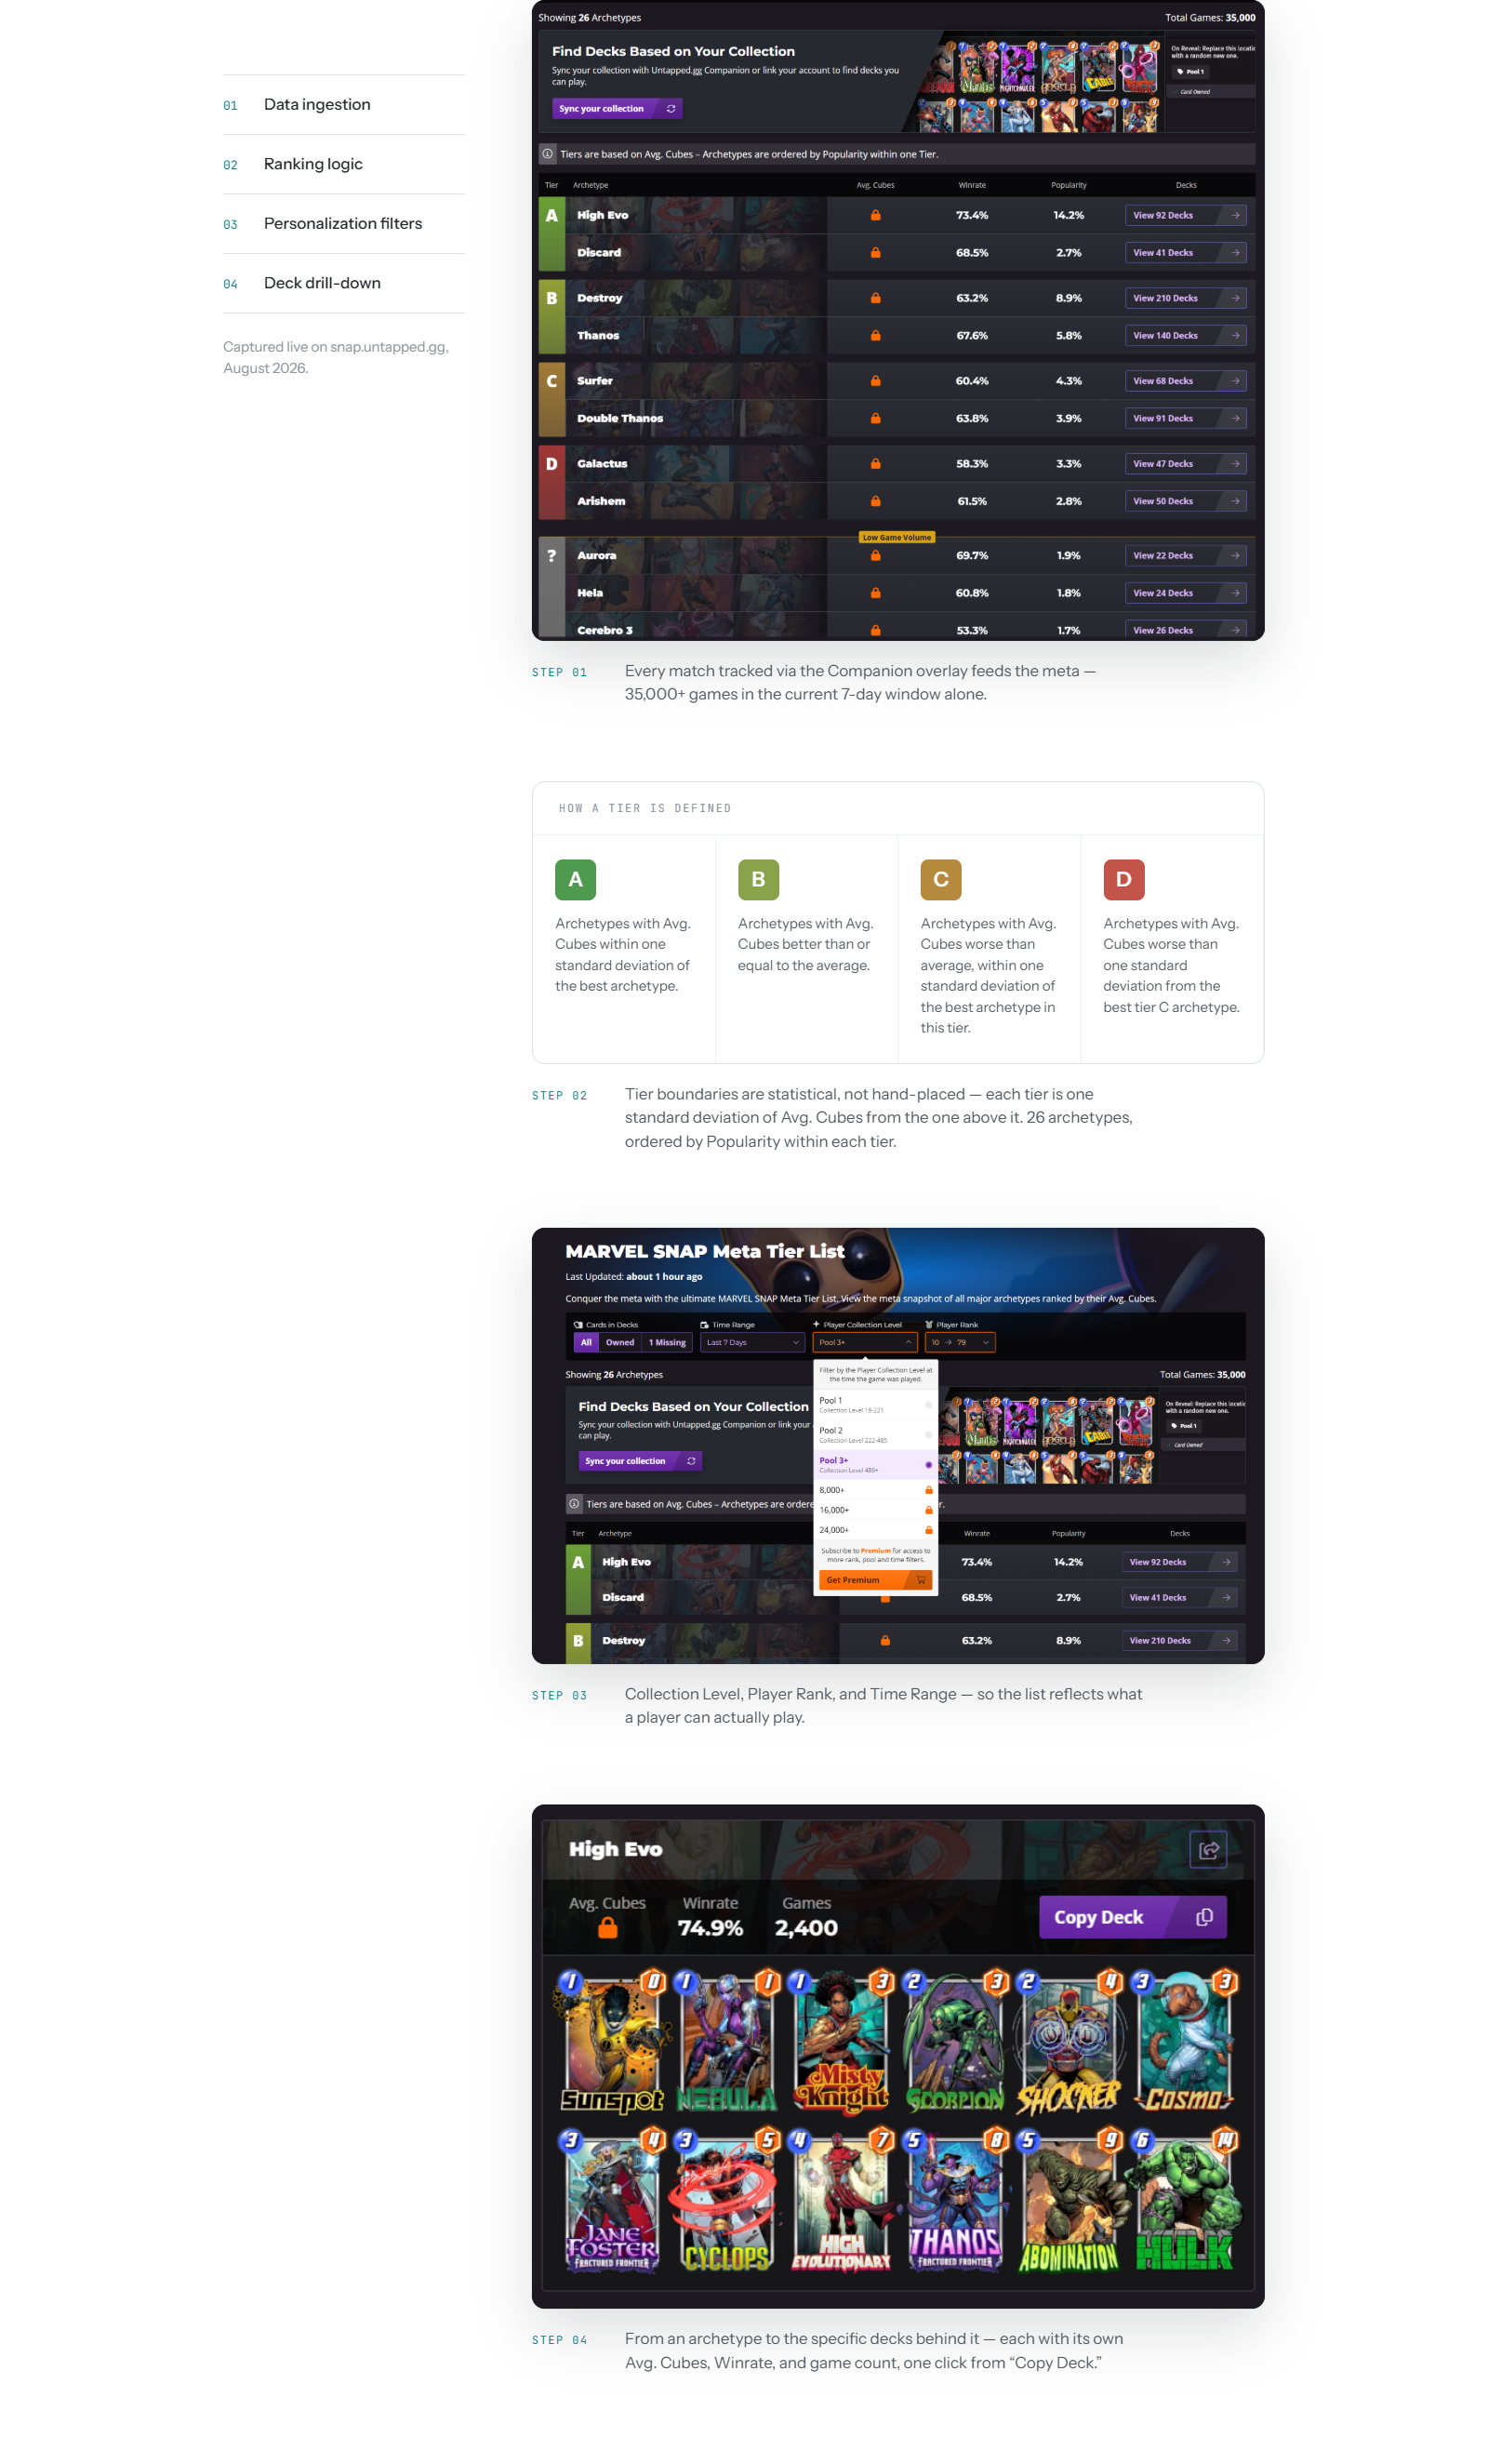
Tier boundaries are statistical, not hand-placed — each tier is one standard deviation of Avg. Cubes from the one above it. 26 archetypes, ordered by Popularity within each tier.
Collection Level, Player Rank, and Time Range — so the list reflects what a player can actually play.
From an archetype to the specific decks behind it — each with its own Avg. Cubes, Winrate, and game count, one click from “Copy Deck.”
Captured live on snap.untapped.gg, August 2026.
Partnered with data and engineering to validate that Avg. Cubes held up statistically at different sample sizes.
A niche archetype with 41 decks needed different confidence handling than High Evo with 92. Very low-population decks don't get suppressed — they're shown with a “Low Game Volume” flag rather than hidden, so players keep visibility into emerging strategies before the data is fully mature.
Full Matchup stats — head-to-head winrate by archetype — were scoped as a Premium feature rather than fully free: a product trade-off between openness and sustainability that shaped how much of the tool sits behind the paywall.
Where it stands
Live and actively used — Meta is now one of the core sections of the product, alongside Decks, Matchups, and Cards. Active users on the section grew significantly after launch.
What I learned
Translating a data pipeline into a ranking people trust means the real design work often isn't visual — it's deciding what the numbers should mean, and being honest about which ones you can't fully trust yet.